December 2025 – present
Compute has no unit. I built one and put a price index on top.
Five months solo as Yggdrasil Financial Technologies, solo founder and developer, then a September rebuild of the index with the construction it should have had from the start. See the full index here: live index.
When and where I was
The idea came out of nothing. Summer 2025, after my freshman year, a friend and I were throwing ideas around as we typically do, and one of them was a market for compute. Neither of us knew what that would look like. We didn't give it another thought.
Thanksgiving break, I was looking to scale a venture. We had been building trading models to sharpen our quant skills, half thinking we would launch a fund or sell strategies, other ideas like CRMs integrated with AI for small businesses were also floating around (eliteweb.ai). Then the compute idea came back around. Cloud GPUs are just an asset. Someone is going to price them like one. It is a massive untapped market, huge potential. I decided that was it and started digging in December 2025.
The question I was trying to answer
Every commodity market that works has a unit. Oil has a barrel of a defined grade. Electricity has a megawatt hour. The unit is what makes a price comparable, and a comparable price is what makes a market.
Compute has no unit. An H100 hour and an MI300X hour and a TPU v5e hour are all "an hour," and none of them is the same thing. So the market prices the box instead of the work, and nobody can tell whether they are overpaying, because there is nothing to divide the price by.
That was the gap I set out to fill: not a compute comparison site, but a unit in which one can measure compute.
I also went looking for how this had been solved before, and found it in electricity. Wholesale power used to be as opaque as compute is now, until federal regulation forced open access and mandatory public posting of available capacity and prices. Standardized disclosure came first, and the market formed on top of it. My first instinct was that compute needed the same push, so I wrote the case for it as legislation. A bold statement, but I wanted to get people's thoughts on it.
What I built and how
I took that paper to a managing director at Goldman Sachs whom I know in January. He thought the problem was real and told me the legislative route was the slow way around: the listings are already public, so just build the index. That redirected everything I did afterward, and he was right.
The unit. If you can measure output from one accelerator using metrics measurable on any other accelerator, you can normalize them against each other, and then you have a unit. I deliberately did not use tokens per second. Tokens depend on the model, the serving stack, batch size and quantization, and you can tune a GPU to produce almost any token number you want. I wanted raw horsepower, and what you do with the horsepower is your business. It's devastatingly simple.
There are four dimensions that are properties of the silicon: floating-point throughput across precisions, memory bandwidth on the card, usable VRAM, and interconnect bandwidth between cards in a cluster. Fancy ways of saying: how fast does this card do math, how fast does this card move numbers within itself, how many numbers can this card store at once, and finally how fast can those numbers be transferred from one card to another. Every accelerator can be scored as a ratio against an 8x H100 SXM cluster and those ratios are combined by a weighted geometric mean, geometric because you are multiplying dimensionless ratios and the result stays scale invariant. Because training is compute bound and inference is memory bound, the same four dimensions are weighted two different ways, producing a Training Compute Unit and an Inference Compute Unit. The headline Compute Unit is the harmonic mean of the two, which is deliberate: a harmonic mean drags toward the weaker number, so a card that trains beautifully and infers badly does not get to average out to "fine."
I filed a provisional patent on the method on January 9, 2026.
The index. I built collectors for published pricing (with no access to real transaction prices, asks collected via API were the best available signal) across the neoclouds and the hyperscalers and normalized everything through the unit, producing dollars per hour per accelerator per region and, more usefully, dollars per compute unit. That ran for months and collected 54M+ price ticks across 28 providers at peak and 56 accelerator models across GPU, TPU, LPU, NPU and ASIC.
Two things fell out of the data that you cannot see without a unit. The listing weighted index traded at a 143% premium to the provider weighted index, meaning the providers with the most listings charge substantially more per unit of compute actually delivered. And individual accelerators were mispriced four to five times against what they deliver, in both directions. Not to mention the 394% premium hyperscalers were charging over neoclouds to rent an H100 SXM in February 2026.
The benchmark. Then I hit the problem that broke the clean version of the story: spec sheets are essentially marketing. A card does not sustain its rated throughput once it is hot, the driver lies about usable VRAM when banks have been mapped out at the factory, and clocks boost differently on a cold card than a warm one. A unit built on published numbers measures the datasheet, not the hardware.
So I prototyped a physical benchmark suite that measures the four dimensions directly. It locks clocks and power limits, holds sustained matrix multiplication until the die reaches thermal steady state, and only then measures, so two cards are compared at the same operating point. It finds real usable VRAM by binary search allocation instead of believing the driver. It reports a trimmed mean and falls back to the median when power throttling makes the distribution bimodal. Every report is sealed with a hash. The number it produces is the empirical Compute Unit, the measured version of the unit rather than the derived one. The one that the index is intended to be denominated by.
The harness is open source at github.com/Yggdr-zil/bm-suite. The unit and the reference values are public in it. The calibration procedure that produces the exponents is not. Note that this benchmark is a prototype and was hastily created to test the theory of measuring these values at a hardware level.
How it ended
I started raising in March. My first angel check valued the company at $12M pre-money and I was getting closer to completing a larger round.
In early May, Silicon Data partnered with CME, and shortly after, Ornn partnered with ICE. Both had been funded roughly five months before I started and had used the lead. Fundraising stopped, which was the correct outcome rather than a sad one: the remaining problem was aggregating volume, and aggregation is a funded team problem. Pooling idle supply against demand and then selling both sides the hedge is not something one person in Dallas wins by working harder.
So I wound it down deliberately instead of spending a year attempting to prove that.
What I took forward
The conviction, which I still hold: compute is going to be traded like a commodity, and the unit problem underneath it is real and unsolved. Five months got me to a filed provisional patent, a live pipeline across 28 providers, a prototype of a physical benchmark and a term sheet conversation, alone and five months behind two funded teams.
At this point the index roles are filled by Ornn and Silicon Data. The unsolved problems of commoditizing compute at the physical level are team problems with large capex and datacenter relations, not a solo one. It is not logical to continue working on such problems myself and if given the chance would rather be inside a team working on the problems in the space rather than running the same race again by myself.
September 2026: rebuilding the index
In September I went back to the index with the intention of understanding what I had built wrong with my prototype and how to fix the index calculation so that it mirrored production indices that exist in the market now. The old index averaged whatever listings reported that day. On February 17 the collector pipeline went from 4 providers to 27 and the index printed −32% while every price I could check had gone up. Three implementations on disk disagreed with each other. None of them chain-linked, none had a proper divisor, none had a base date, it was operating more like a poorly constructed compute price level than an index.
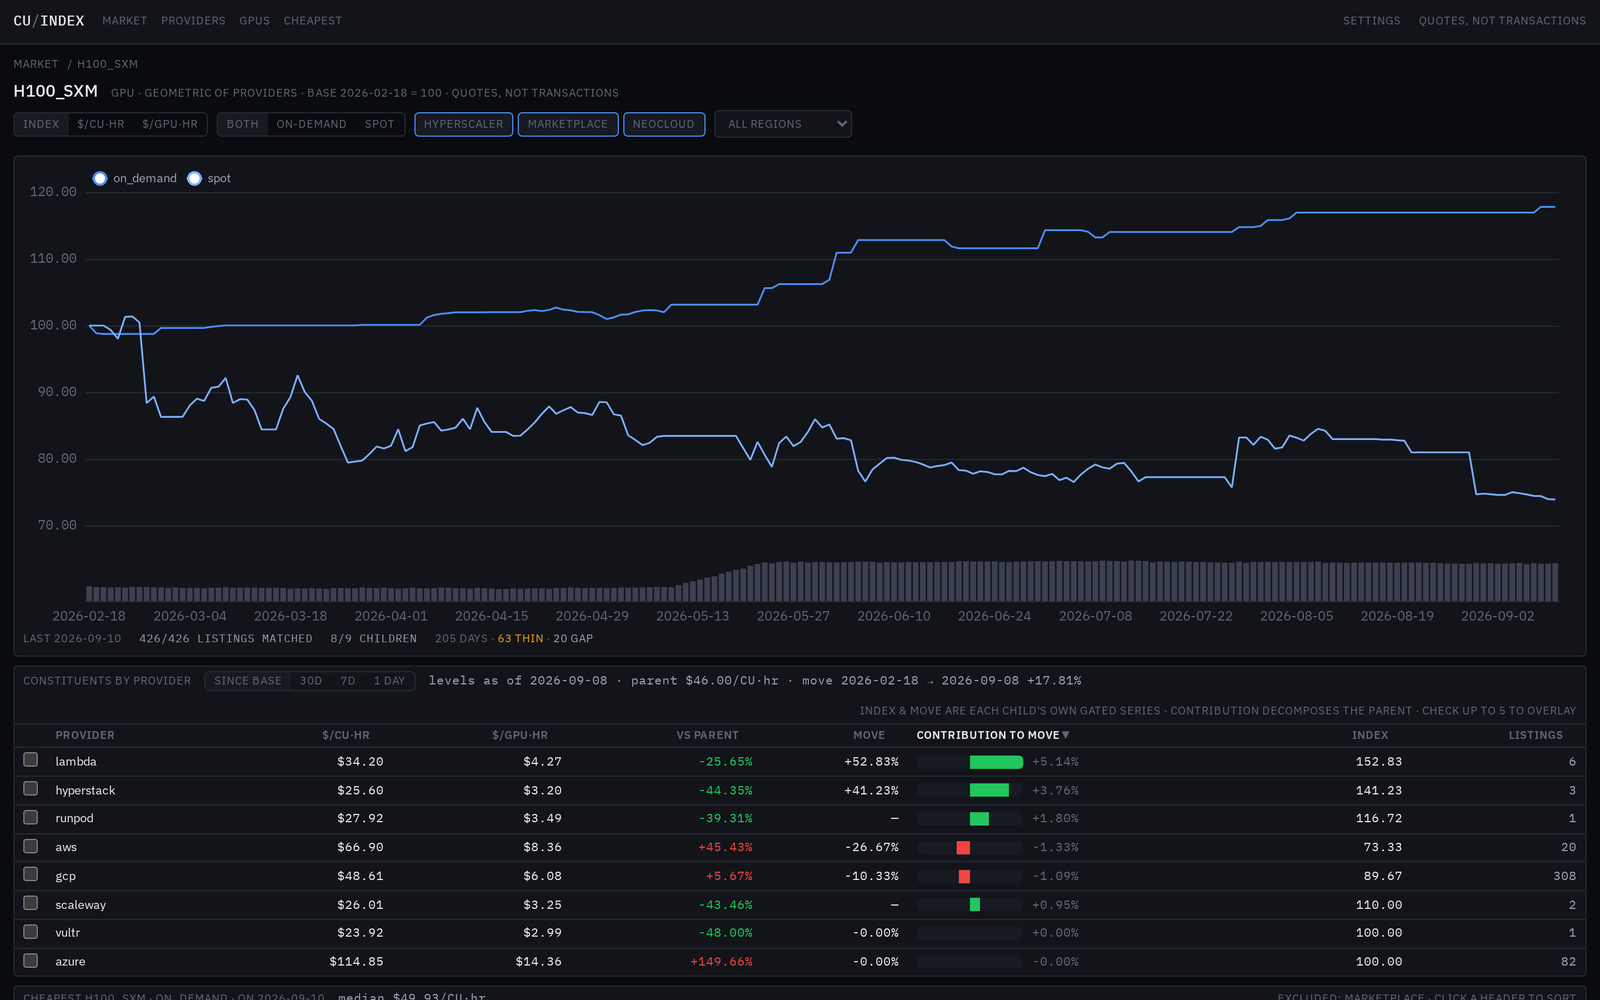
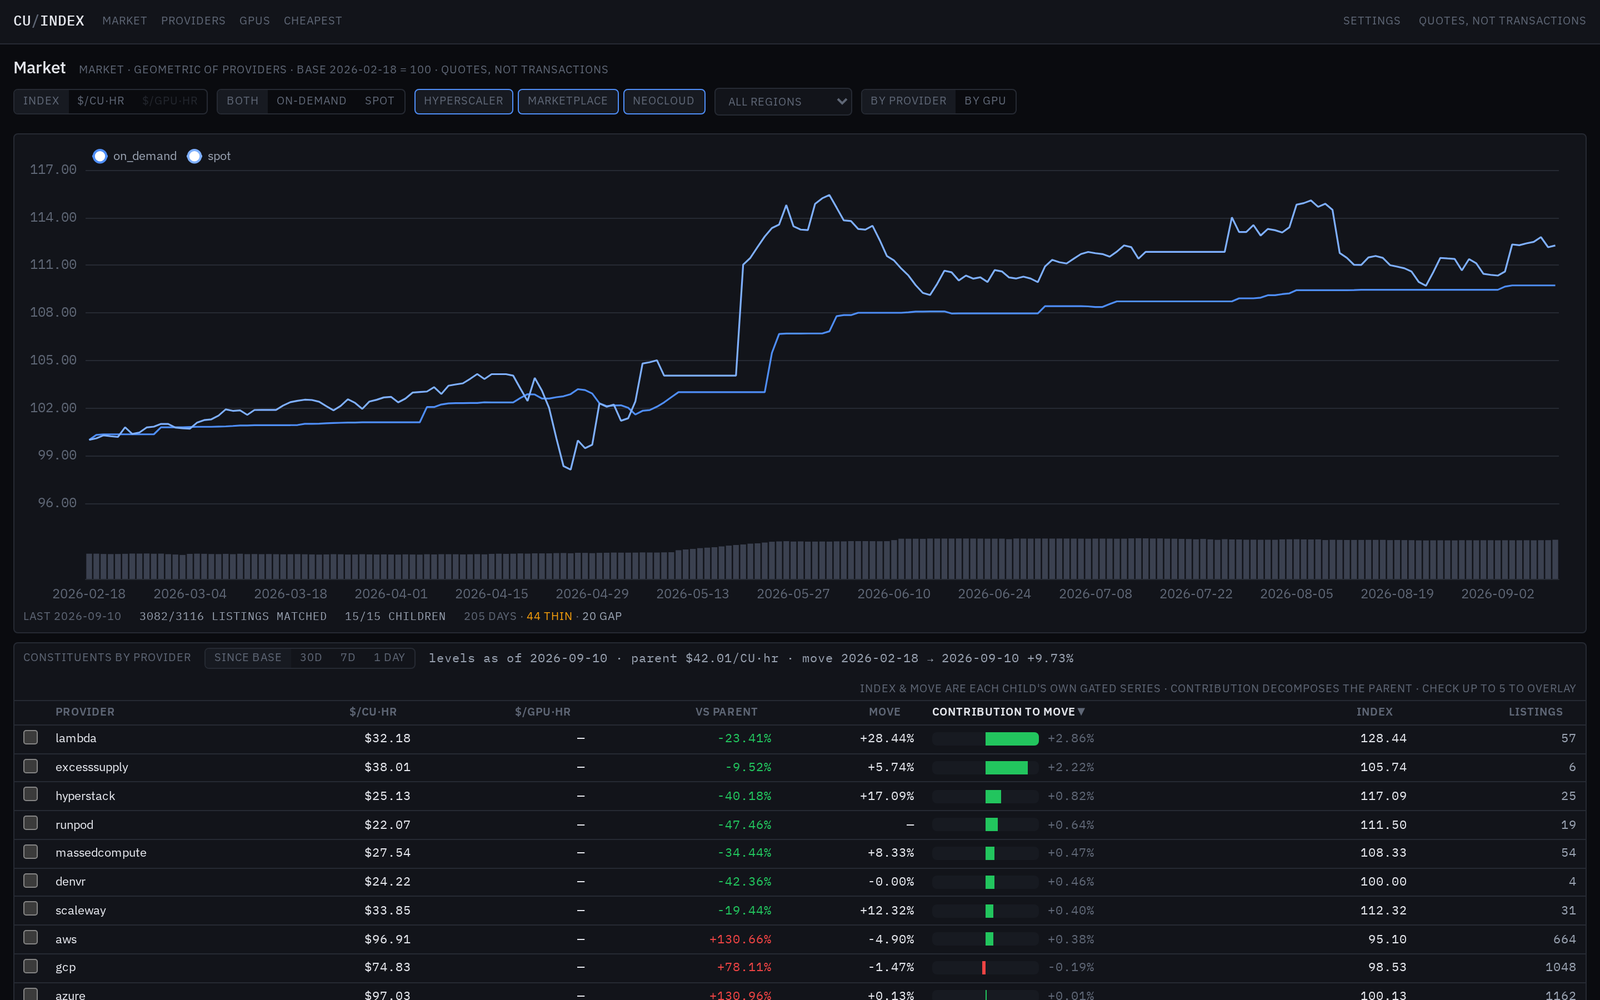
The rebuild is a chain-linked geometric index which measures the percent change in the price of compute over time, the way the Case-Shiller index measures home price changes. Each listing contributes the ratio of its price today to its price yesterday, matched on the same provider, GPU, instance, region and price type. Those relatives are combined by geometric mean and chained from 100 on February 18. The CU score cancels in the ratio, so revising the unit never rewrites history. Every day is graded ok, thin or gap against a rolling seven-day median of listing counts. A thin day publishes no level and the chain carries flat, which is the amber band on the chart (hidden by default).
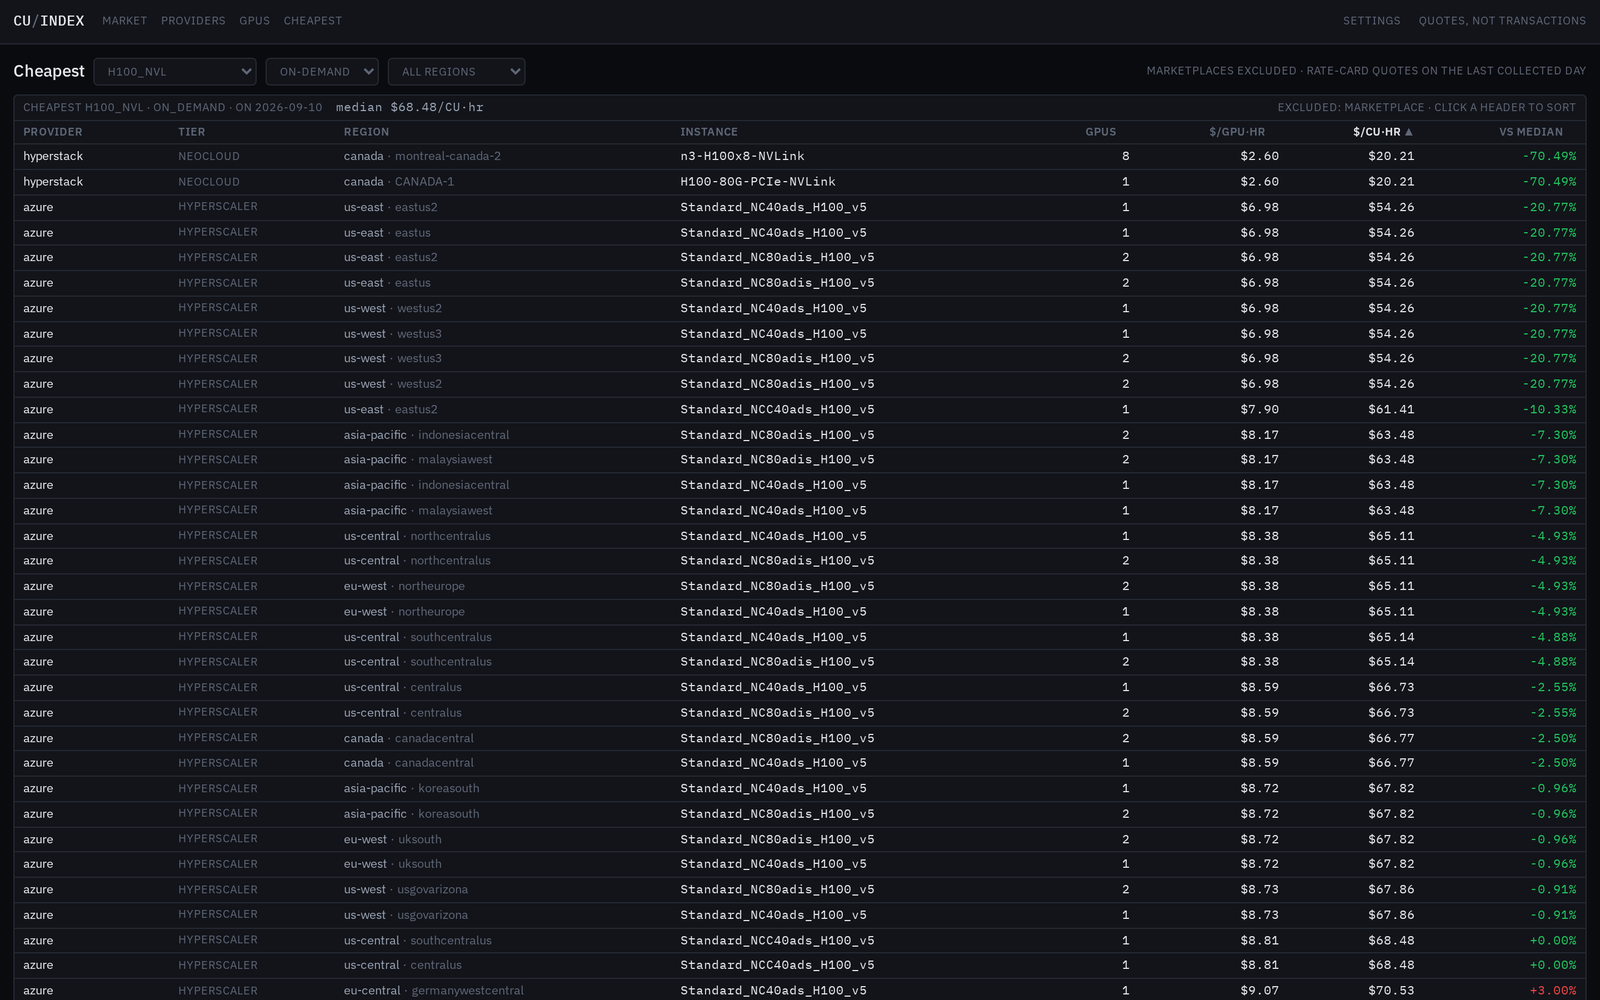
I also created a CU price level which measures each median of a gpu types $/CU-hr then takes the mean of all these medians to publish a price level of what it costs on average across the entire market to purchase one hour of compute that produces the same level of computing power as one hour of time on an H100 SXM cluster of 8.
February 17 now chains at −2.3%.
What it still is not: it is quotes, not transactions, and providers are equally weighted because book depth is not observable from a rate card. Weighting by what actually clears needs an order book, and that is not something one person builds from the outside.
As of September 10, 2026: 54M+ ticks, 15 of 28 providers reporting, 42 GPUs, 3,116 listings. 205 days, 169 ok, 15 thin, 21 gap. Market on-demand index 105.78.